> ## Documentation Index
> Fetch the complete documentation index at: https://docs.xpertai.cn/llms.txt
> Use this file to discover all available pages before exploring further.
# 🔝排序排名
排序排名 (Sorting and Ranking) 是数据分析应用的一个非常常见的需求, 它提供数据的排序和排名视图。用户总是对前 10 名榜单感兴趣,经常想看看谁或什么在上个月或去年排名第一。在本章中,我们将介绍排序和排名的基础知识,并了解一些更高级的排序和排名计算。
## 排序排名
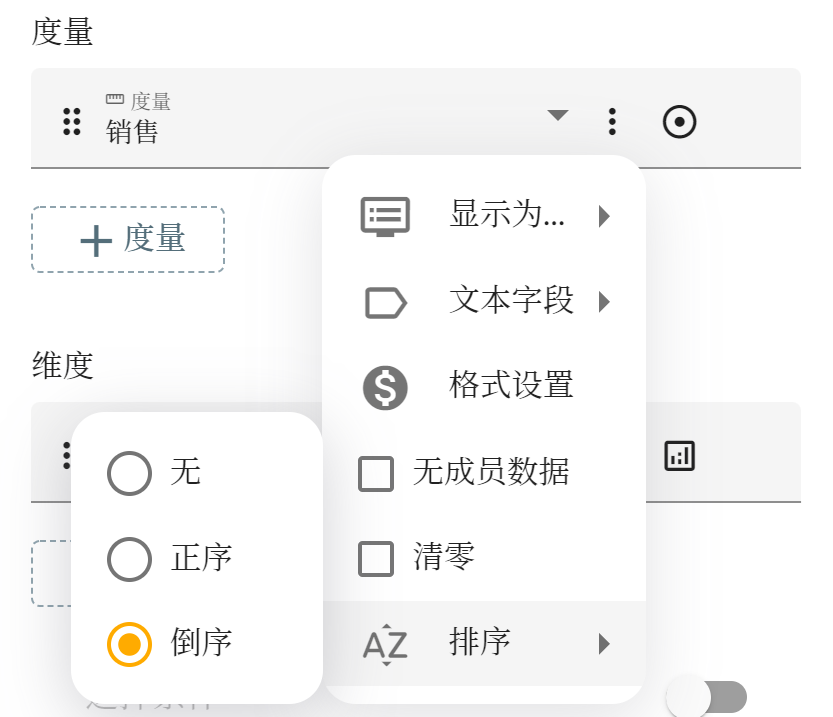
对维度成员排序, 可以通过对度量设置排序属性, 那么程序会根据此度量值大小对维度成员进行相应的排序. 也可以对维度本身设置排序属性, 那么程序就使用维度本身的顺序进行排序.
下图是设置度量的排序属性:
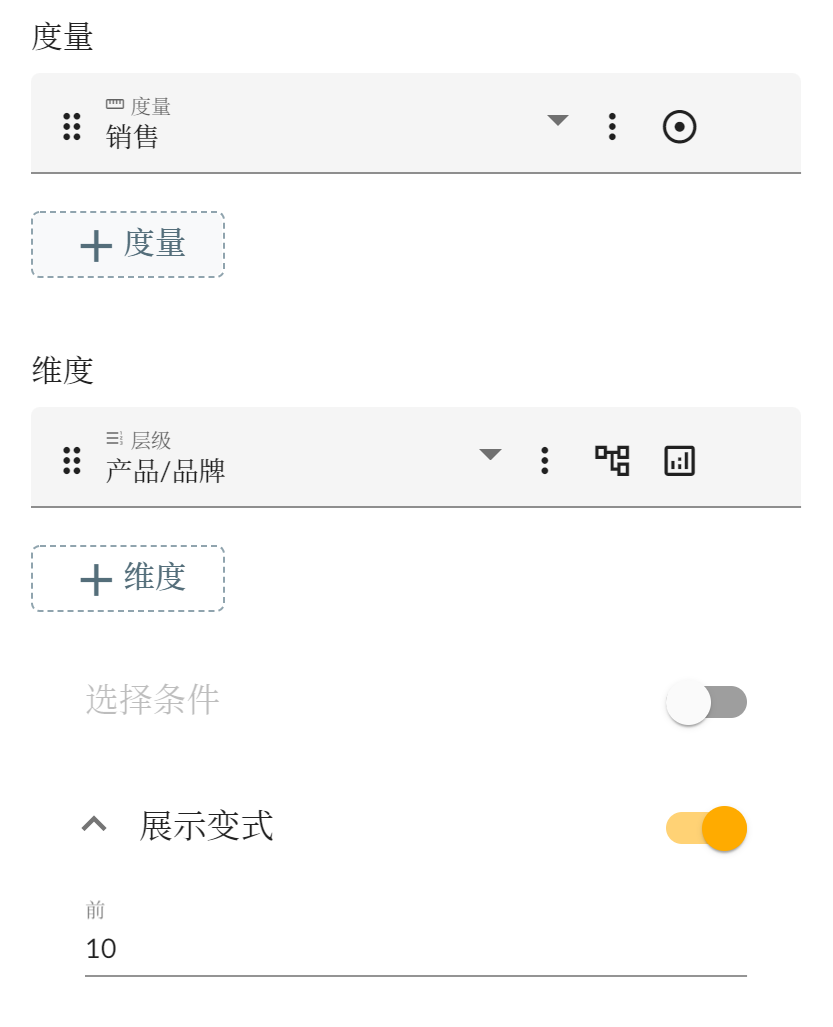
 排序后再通过展示变式中的**前**多少属性设置排名, 取前多少的成员:
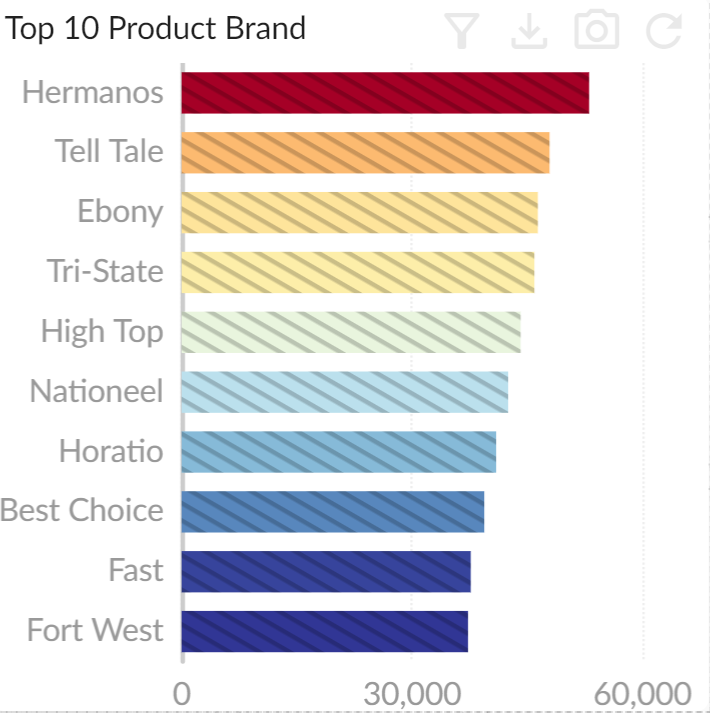
 排序排名后的结果将展示按度量排序后前多少名的成员, 这里是倒序前 10 名成员, 再设置图形 **分类轴** 的 **倒转** 属性, 数据将按从大到小从上到下的形式展现出来, 如下图:
 ## 高级排序排名
> MDX
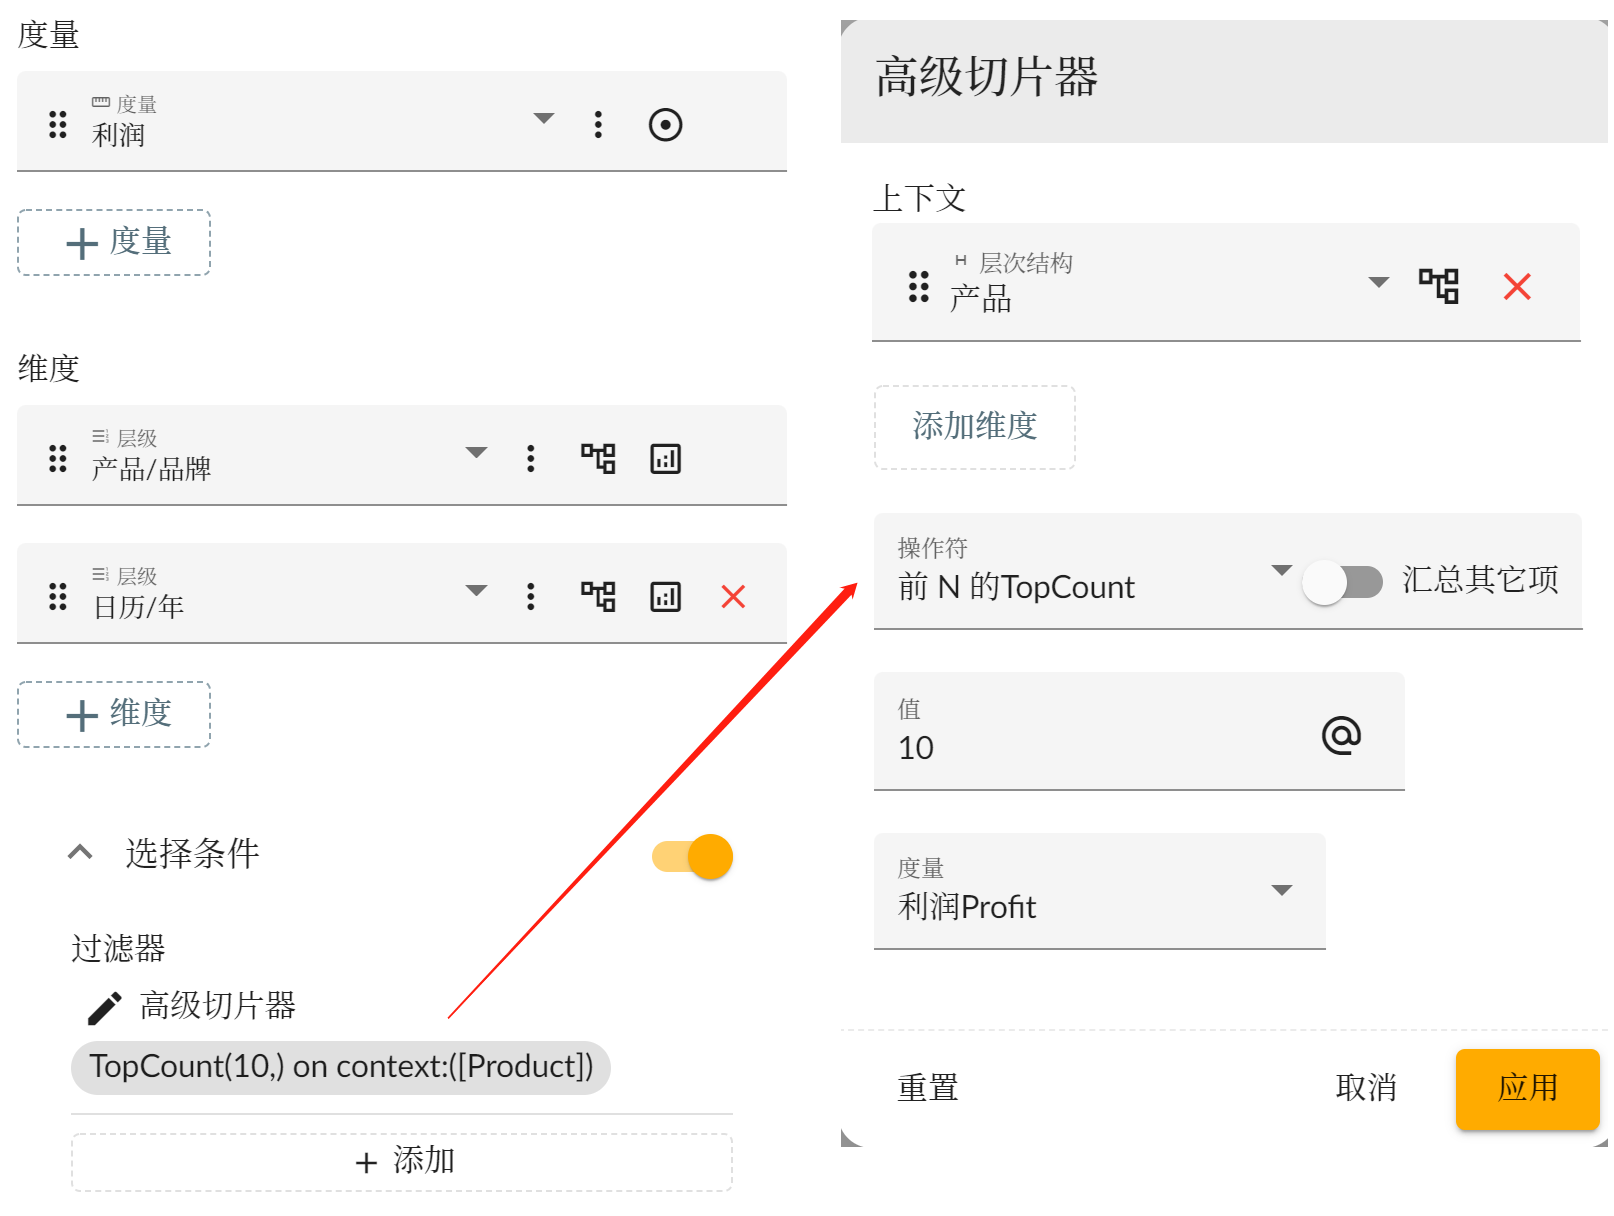
更进一步, 如果我们要查看 **每一年** 的 **利润** 前 **10** 名的 **产品品牌**, 那么可以通过设置高级切片器来实现.
首先图形的维度需要设置 **日历/年** 和 **产品/品牌** 两个维度, 然后在选择条件中添加 **高级切片器** 类型的过滤器. 将 **产品** 维度设置为高级切片器的上下文, 选择操作符(函数)为 **TopCount**, 值设置为 **10**, 度量选择 **利润 Profit** (可以与图形配置中的度量不同).
关于高级切片器的详细配置请参考 [高级切片器](../advanced-slicer/).
## 高级排序排名
> MDX
更进一步, 如果我们要查看 **每一年** 的 **利润** 前 **10** 名的 **产品品牌**, 那么可以通过设置高级切片器来实现.
首先图形的维度需要设置 **日历/年** 和 **产品/品牌** 两个维度, 然后在选择条件中添加 **高级切片器** 类型的过滤器. 将 **产品** 维度设置为高级切片器的上下文, 选择操作符(函数)为 **TopCount**, 值设置为 **10**, 度量选择 **利润 Profit** (可以与图形配置中的度量不同).
关于高级切片器的详细配置请参考 [高级切片器](../advanced-slicer/).
 将 **日历/年** 维度的 **角色** 属性设置为 **格子**, 将得到按年分别绘制的不同坐标系, 展示每年的利润前 10 名产品品牌, 如下图:
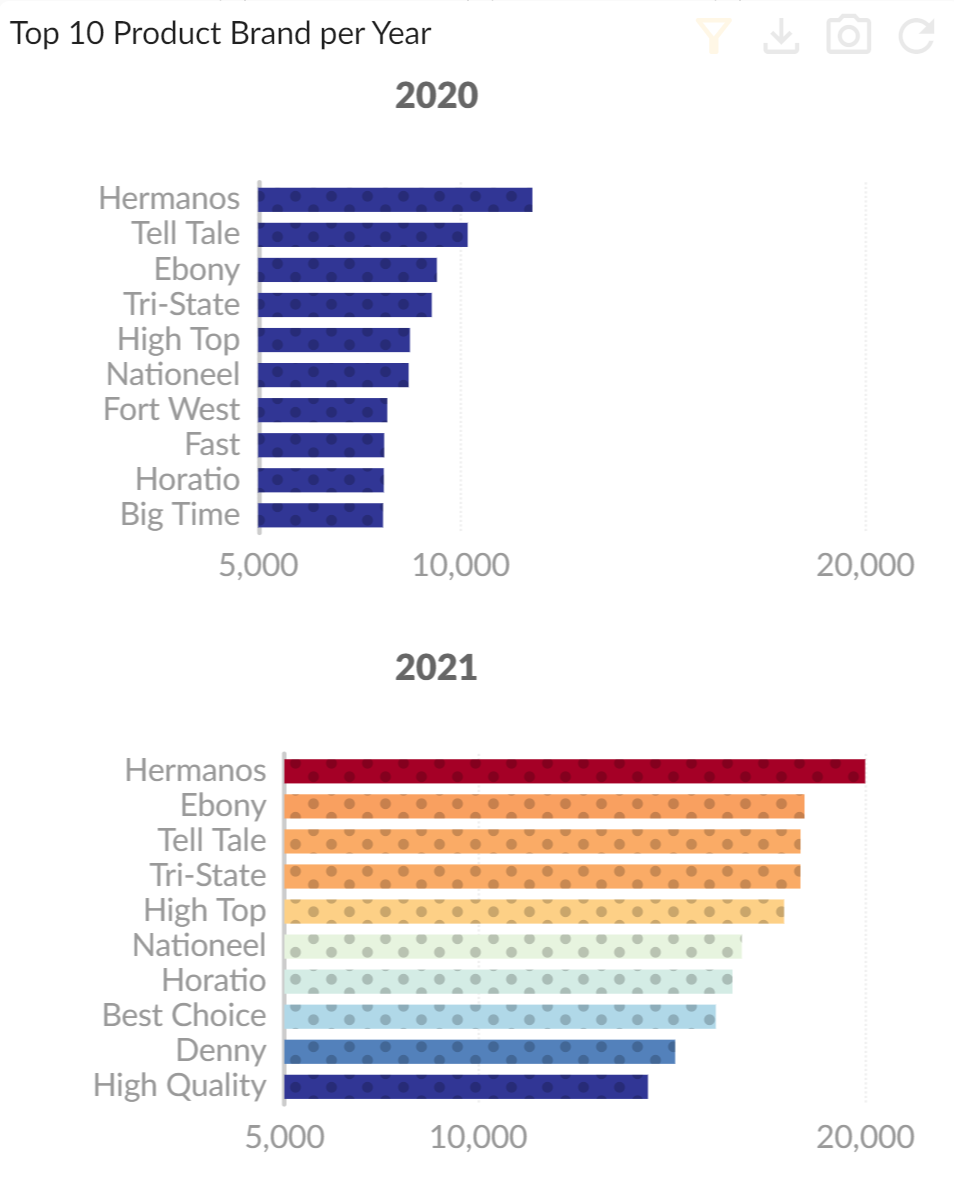 为了更明显对比不同坐标系之间的差异, 设置图形属性 **值轴** 中的 **最小值**: 5000, **最大值**: 20000, 所有的坐标系值轴将展示为相同的范围.
关于图形组件的详细配置请参考 [组件 - 分析卡片](../../widgets/analytical-card).
## 排序排名函数
> MDX
如果是更复杂的排序排名需求可以在计算公式度量中使用排序(**Order**)排名(**Rank**)函数.
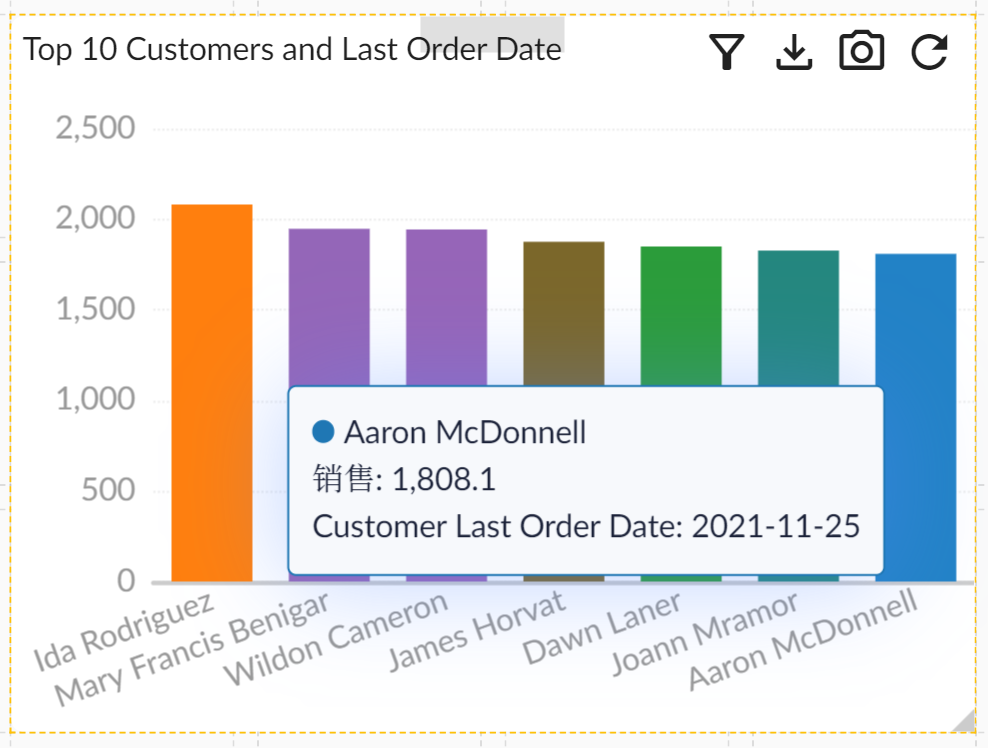
假设我们要计算购买前 10 名的客户并且计算其最后下单日期, 创建客户最后下单日期的计算度量 **Customer Last Order Date**, 计算公式为:
```sql theme={null}
ORDER(FILTER(
NonEmptyCrossjoin(
{[Customers].CurrentMember}
, {[Time].[Day].MEMBERS}
)
, Not(IsEmpty([Measures].[Sales]))
)
, [Time].CurrentMember.Name
, DESC
).ITEM(0).ITEM(1).Name
```
为了更明显对比不同坐标系之间的差异, 设置图形属性 **值轴** 中的 **最小值**: 5000, **最大值**: 20000, 所有的坐标系值轴将展示为相同的范围.
关于图形组件的详细配置请参考 [组件 - 分析卡片](../../widgets/analytical-card).
## 排序排名函数
> MDX
如果是更复杂的排序排名需求可以在计算公式度量中使用排序(**Order**)排名(**Rank**)函数.
假设我们要计算购买前 10 名的客户并且计算其最后下单日期, 创建客户最后下单日期的计算度量 **Customer Last Order Date**, 计算公式为:
```sql theme={null}
ORDER(FILTER(
NonEmptyCrossjoin(
{[Customers].CurrentMember}
, {[Time].[Day].MEMBERS}
)
, Not(IsEmpty([Measures].[Sales]))
)
, [Time].CurrentMember.Name
, DESC
).ITEM(0).ITEM(1).Name
```
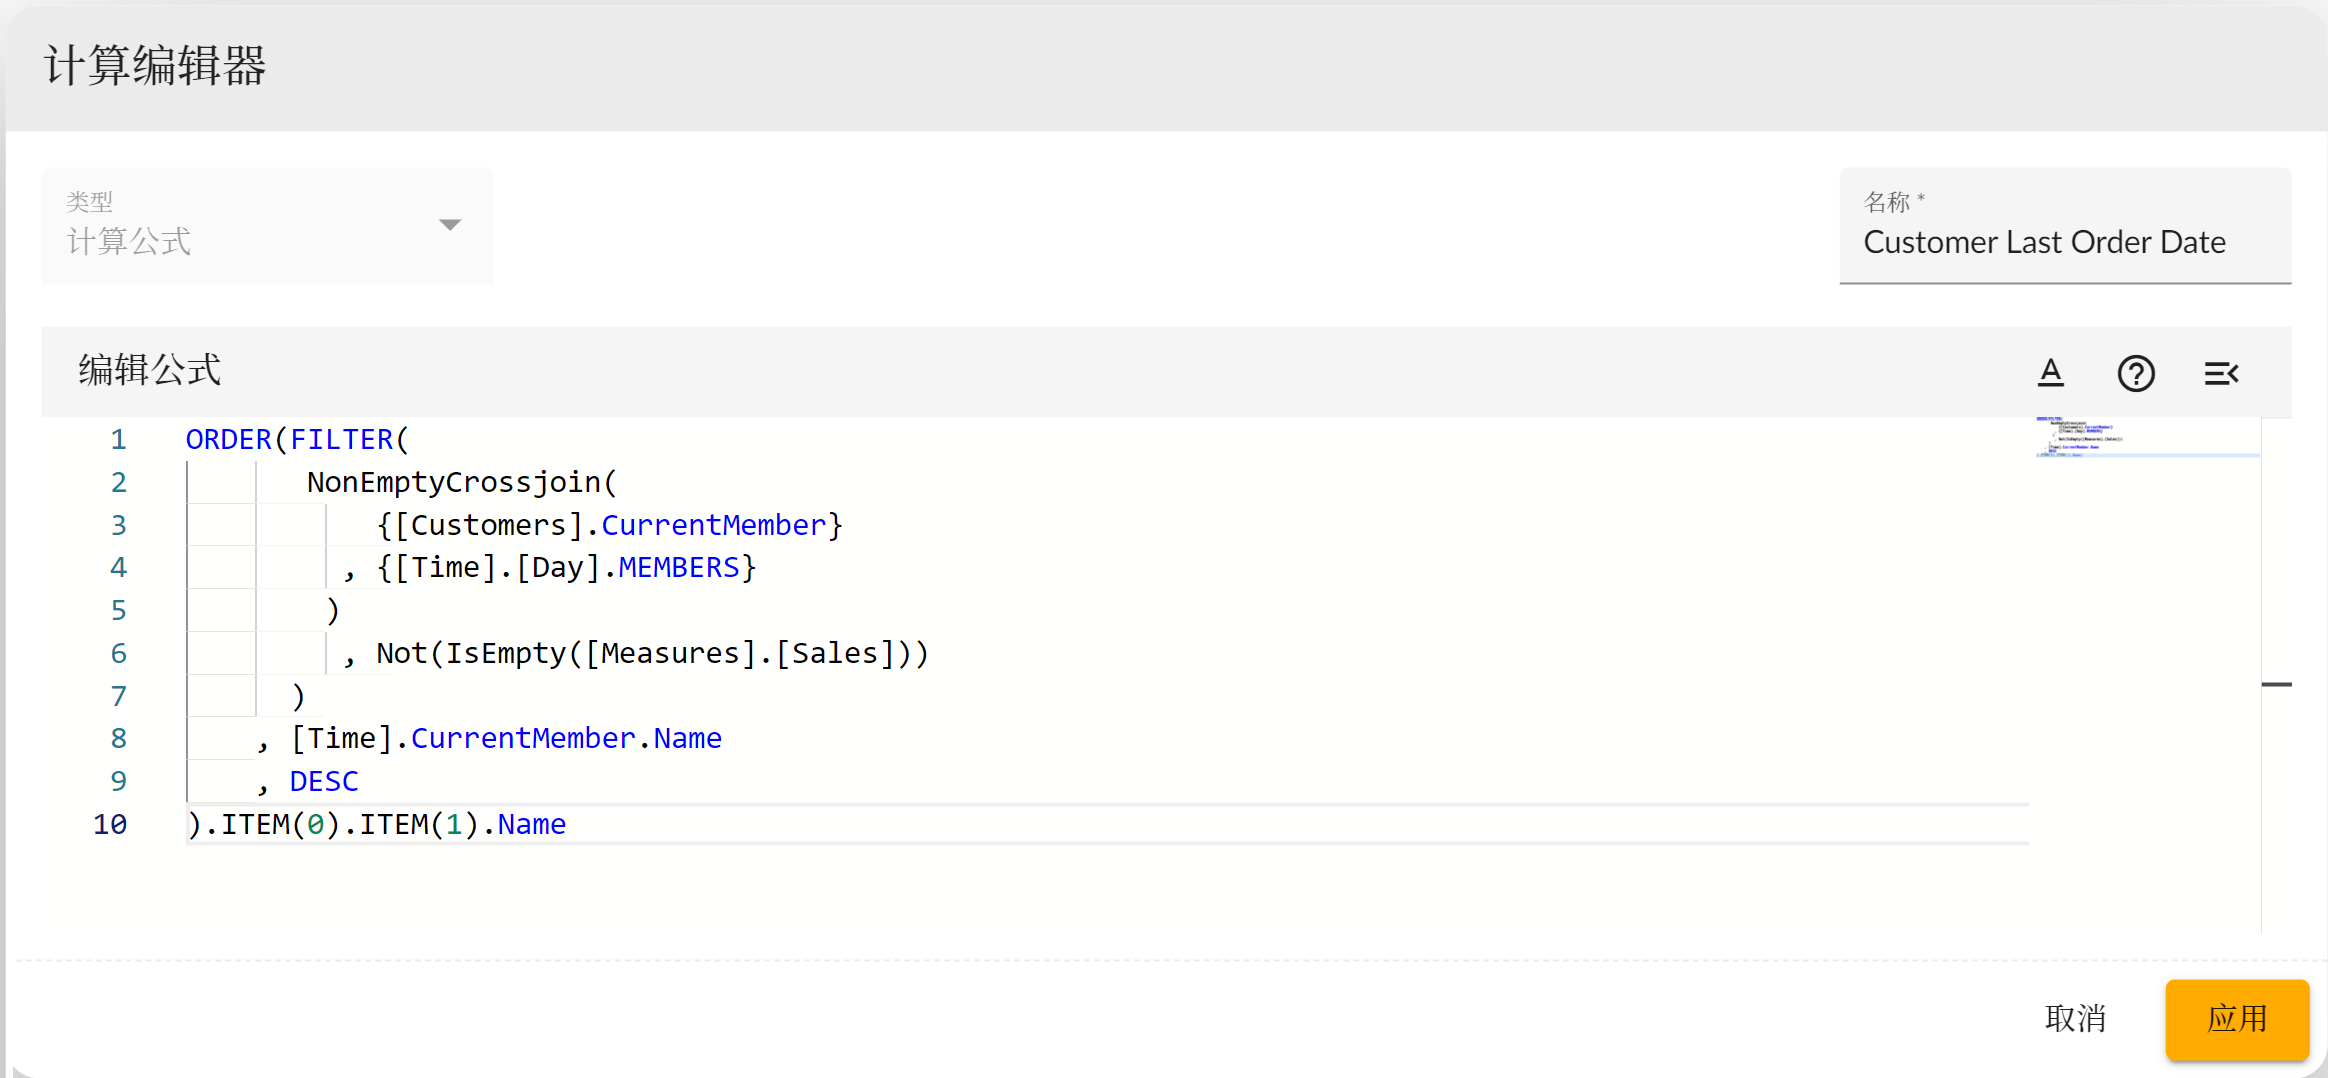 在图形的度量中添加 **Customer Last Order Date** 计算度量, 并将其角色设置为 **提示信息**, 这样客户的最后下单日期将会展现在图形的提示信息框中.