> ## Documentation Index
> Fetch the complete documentation index at: https://docs.xpertai.cn/llms.txt
> Use this file to discover all available pages before exploring further.

# 河流图

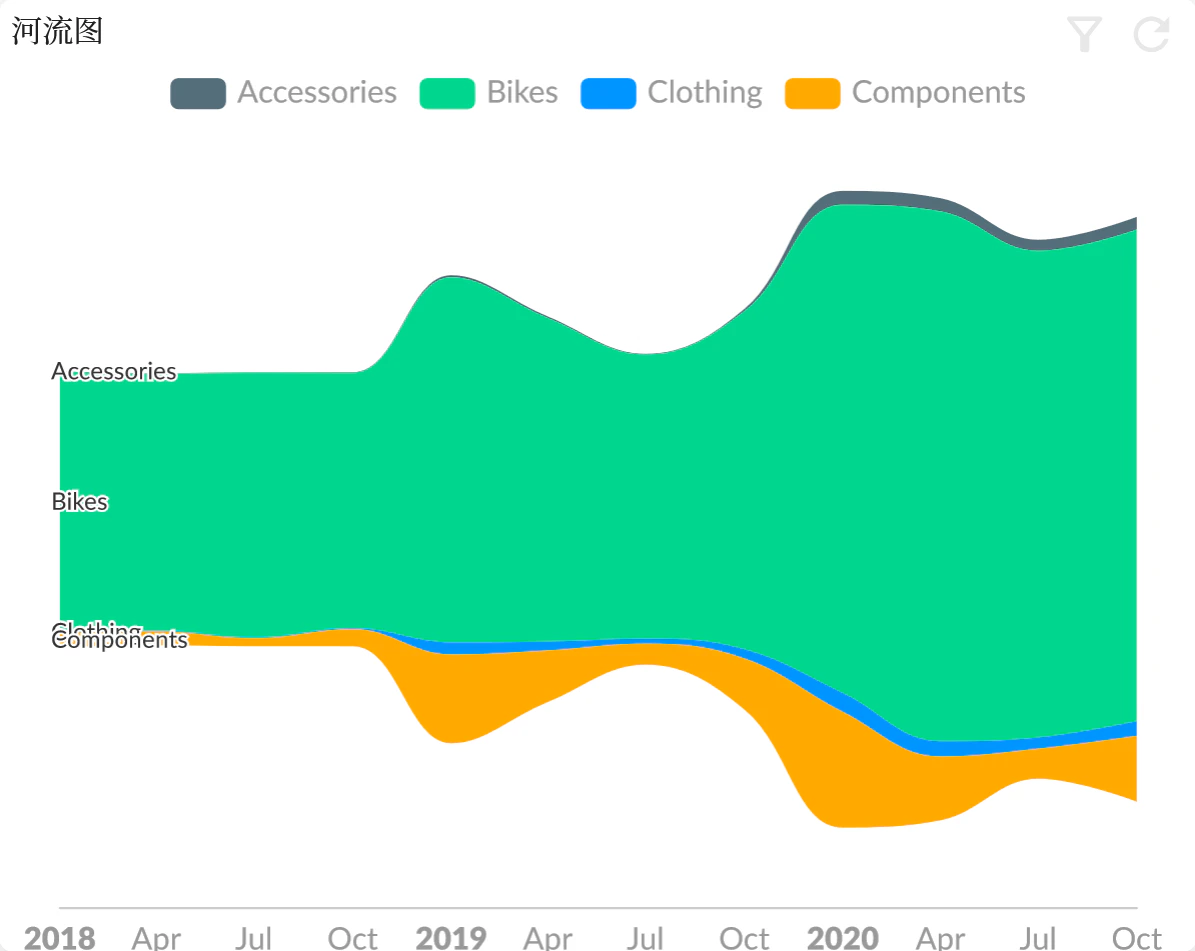
**河流图**（Streamgraph），有时候也叫做“**主题河流图**”（ThemeRiver），是堆积面积图的一种变形，通过“流动”的形状来展示不同类别的数据随时间的变化情况。但不同于堆积面积图，河流图并不是将数据描绘在一个固定的、笔直的轴上（堆积图的基准线就是x轴），而是将数据分散到一个变化的中心基准线上（该基准线不一定是笔直的）。

由河流图的组成图可以看出，河流图用颜色区分不同的类别，或每个类别的附加定量，流向则与表示时间的X轴平行。每个类别的对应数值则是通过 “河流”的宽度展示出来。每个类别的数值变化就会形同一条粗细不一的小河，汇集、扭结在一起，河流图也因此而得名。

## 创建河流图

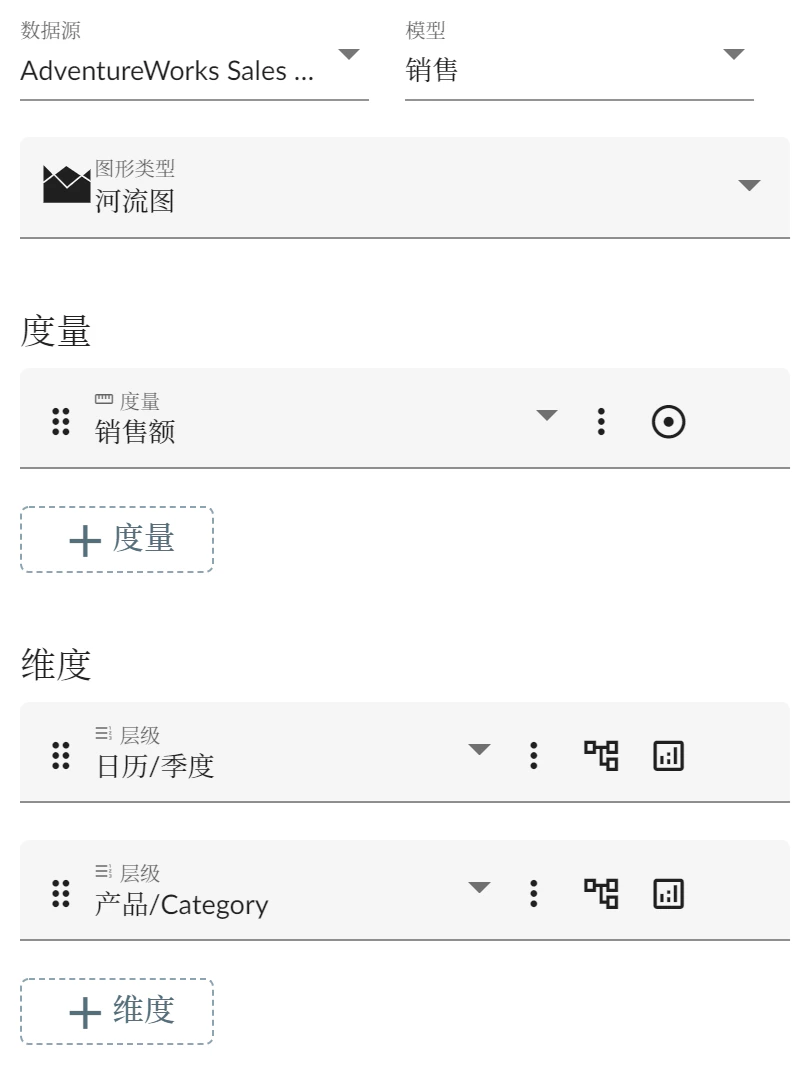
选择图形类型为 **河流图**, 并添加一个度量和两个维度:

1. 主维度为日历语义类型的维度, 日历维度成员将转换成标准的时间对象.
2. 次维度选择要做成员对比的维度.
<img src="https://mintcdn.com/xpertai/Qps79FDII81ZU_Y9/public/img/widgets/theme-river/theme-river-attributes.png?fit=max&auto=format&n=Qps79FDII81ZU_Y9&q=85&s=62f602d3a59a835457eaf30d8d2306da" alt="Small" width="809" height="1071" data-path="public/img/widgets/theme-river/theme-river-attributes.png" />

河流图展示效果如下

<img src="https://mintcdn.com/xpertai/Qps79FDII81ZU_Y9/public/img/widgets/theme-river/theme-river.png?fit=max&auto=format&n=Qps79FDII81ZU_Y9&q=85&s=ba3f1421db6bedc0906b9d2bedd8913d" alt="Middle Shadow" width="1195" height="951" data-path="public/img/widgets/theme-river/theme-river.png" />

## 示例

<iframe src="https://app.xpertai.cn/public/story/point/9e67546d-b764-4a00-b4fe-a956c2095fa1" width="100%" height="500px" frameBorder="0" scrolling="no" allowFullScreen />