> ## Documentation Index
> Fetch the complete documentation index at: https://docs.xpertai.cn/llms.txt
> Use this file to discover all available pages before exploring further.

# 散点图

**散点图**用两组数据构成多个坐标点，考察坐标点的分布, 判断两变量之间是否存在某种关联或总结坐标点的分布模式。
散点图将序列显示为一组点。值由点在图表中的位置表示。类别由图表中的不同标记表示。散点图通常用于比较跨类别的聚合数据。

## 创建散点图

散点图的 x 轴和 y 轴使用两个不同的度量字段来决定数据项在坐标系中的分布, 并可以设置更多度量来展示颜色明暗或者三点大小等特征.
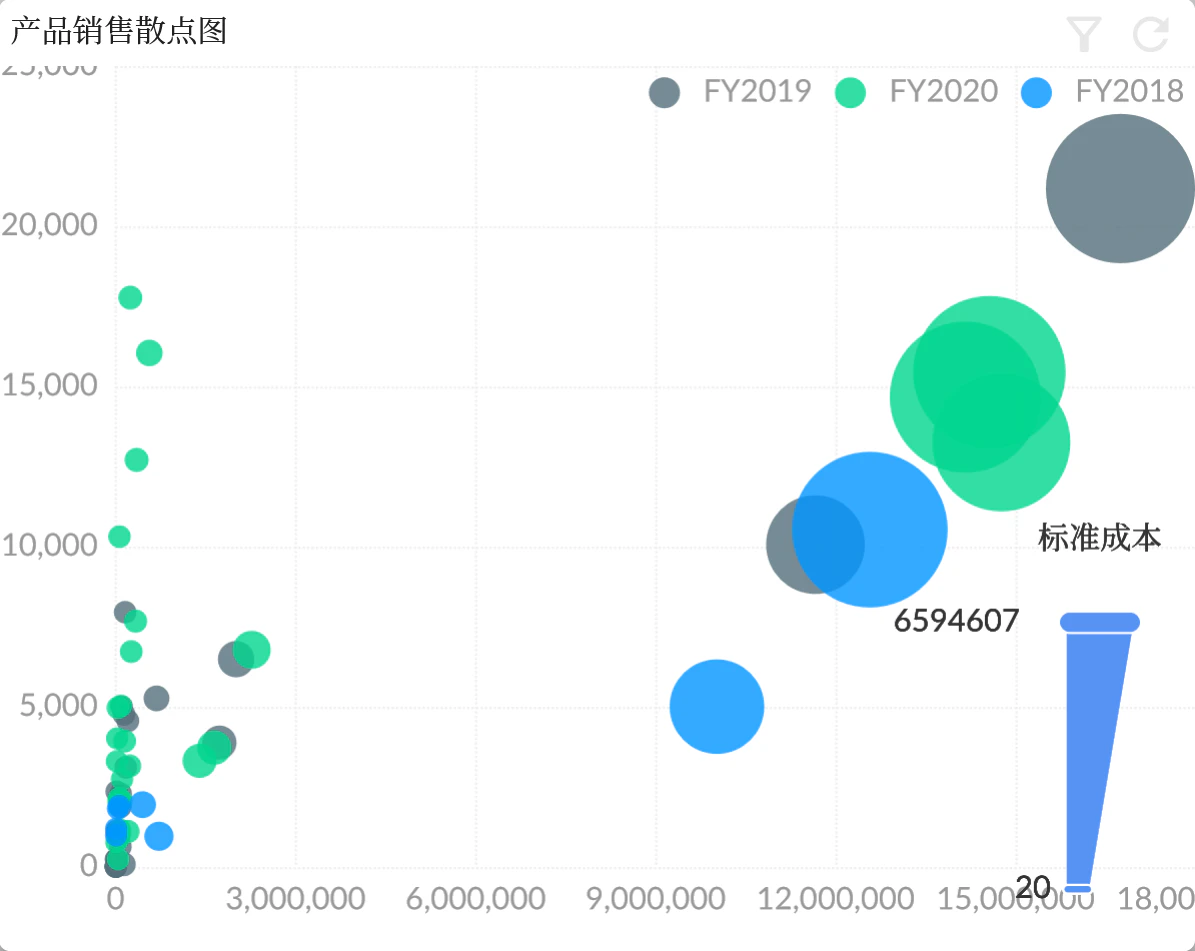
<img src="https://mintcdn.com/xpertai/Qps79FDII81ZU_Y9/public/img/widgets/scatter/scatter.png?fit=max&auto=format&n=Qps79FDII81ZU_Y9&q=85&s=fedea855caaf13d2ce49fad956cf4a47" alt="Middle" width="1195" height="951" data-path="public/img/widgets/scatter/scatter.png" />

## 示例

<iframe src="https://app.xpertai.cn/public/story/point/f681ab4e-261c-40b8-8fcd-632ca4874755" width="100%" height="1000px" frameBorder="0" scrolling="no" allowFullScreen />
